Key conclusions
Within the upcoming decades, Slovakia will be facing higher costs caused by demographic developments, exposing the public finances to an ever-increasing pressure. One of the main tasks of the Council for Budget Responsibility (“CBR”) laid down in the Fiscal Responsibility Act[1] is to publish the Report on the Long-term Sustainability of Public Finances. The report evaluates whether public policies, in conjunction with the assumed demographic and macroeconomic development, have been set up in a sustainable manner from the perspective of public finances.
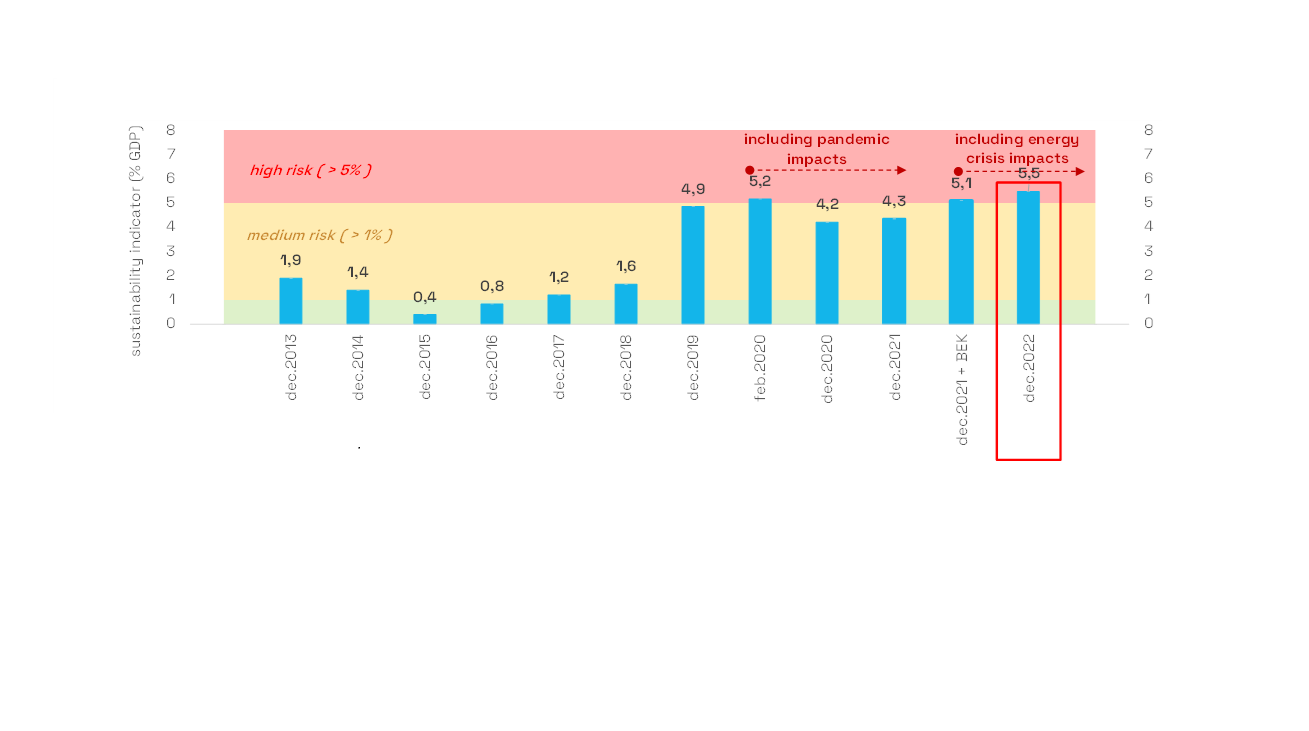
Long-term sustainability of public finances for 2022 at high risk
The baseline scenario presented in this report is based on inputs at the end of 2022, captures the consequences of the security and energy crisis[2] on the long-term sustainability of public finances, and covers the impacts of measures adopted in 2022. The CBR concludes that the long-term sustainability of public finances has again not been achieved in 2022 [3]. The long-term sustainability indicator reached 5.5% of GDP (6.6 bn euros), sending the public finances to the high-risk zone [4].
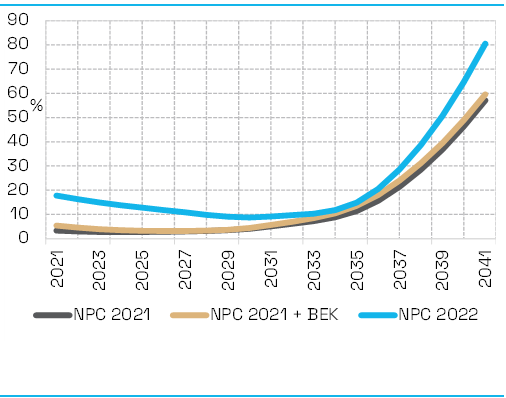
Development of the long-term sustainability indicator (% of GDP)
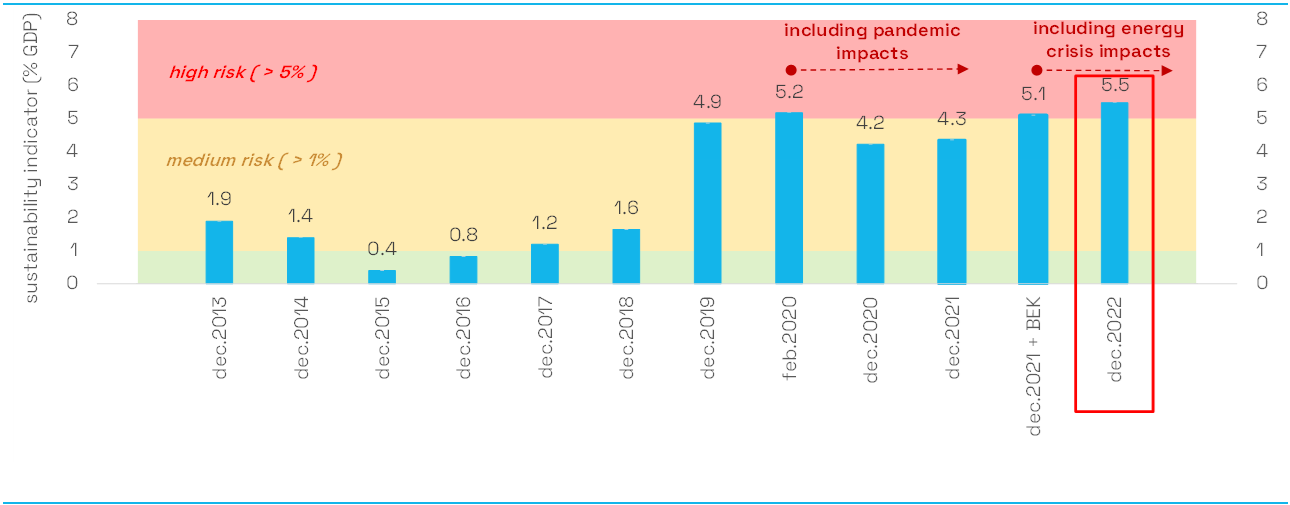
Note: BEK – direct impact of the security and energy crisis
Net of the impact of the mandatory enrolment in the second
pension system pillar, the indicator would be at 4.7% of GDP in 2022.
Source: CBR
Medium-term development in public finances and pensions among the main causes of problems with the long-term sustainability
The public finances were in a much better than expected shape in 2022, with the level of structural balance[5] at which they would be sustainable over the next 50 years. However, the result was mainly driven by a high rate of inflation which led to a sharp rise in general government revenues but its effect on expenditures will fully be felt a year later. The 2022 result will have no perceptible impact on the long-term sustainability, nor does it indicate a further trend in the public finance development.
Long-term sustainability indicator in 2022 (% of GDP)
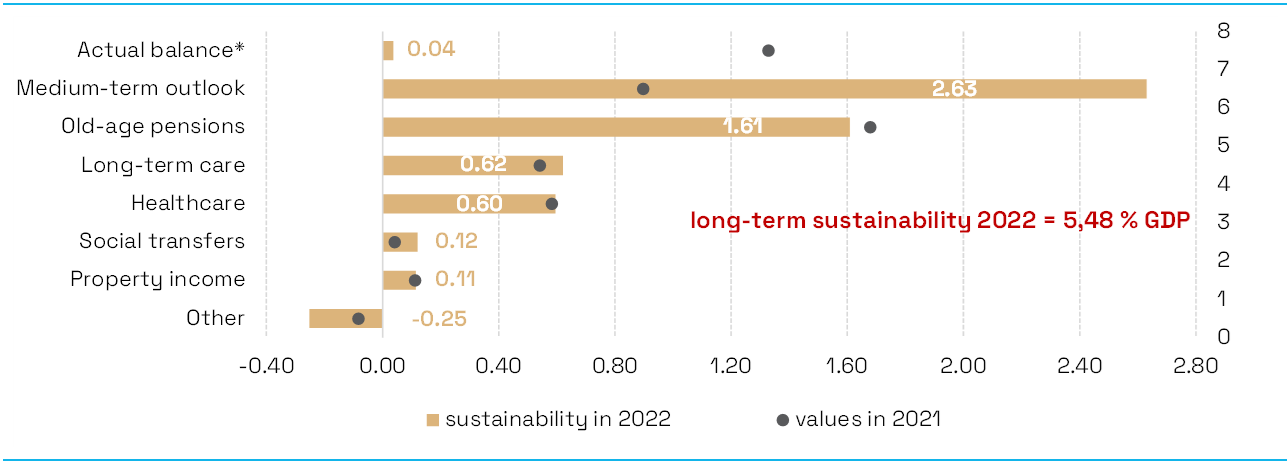
Note: * impact of the initial budgetary position, i.e., the structural primary balance and gross debt in 2022;
Medium-term outlook – development in all GG balance items between 2022 and 2026
Source: CBR
By contrast, due to the delayed growth in expenditures and measures adopted in 2022, the CBR anticipates a considerably less favourable medium-term development in public finances, contributing 2.6% of GDP to the increase in the sustainability indicator.
Beyond the medium term, in the period between 2026 and 2027, the development in public finances contributes additional 2.8% of GDP to the worsening of the long-term sustainability, mainly due to higher expenditures sensitive to population ageing. The largest negative impact, at 1.6% of GDP, comes from the growth in the pension system deficit. The sustainability will worsen by additional 1.2% of GDP due to higher health and long-term care expenditures.
Security and energy crisis augmented by the war in Ukraine had the largest impact on the decline in sustainability
Compared o 2021, the sustainability of public finances worsened by 1.1% of GDP in 2022, or 0.4% of GDP if the impact of the reform in the second pension system pillar [6] is omitted. The security and energy crisis had the largest negative effect of 0.8% of GDP[7]. The government’s economic policy had a neutral effect on the sustainability; however, there is a significant time mismatch between the immediate expenditures and gradually accruing future savings from the reform of the first pension system pillar. Assumed forced cuts in local government expenditures improve the sustainability by 0.5% of GDP. Macroeconomic developments not affected by the war in Ukraine had a slightly negative impact.
Change in the long-term sustainability of public finances in 2022
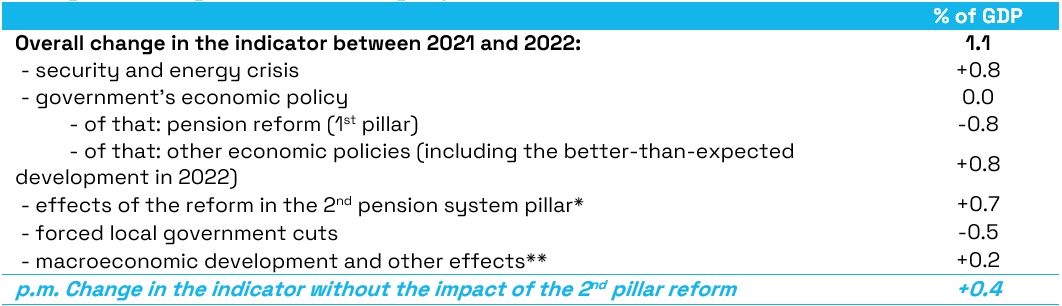
Note: (+) means deterioration and (-) improvement in the long-term sustainability indicator
* The reform of the 2nd pension system pillar (due to the 50-year horizon) worsens the sustainability, even though its negative impact declines considerably over the horizon. The European Commission does not take into account the impact of the 2nd pillar (on the revenue side) when presenting sustainability indicators.
**Including, for example, possible negative impacts of Russia’s energy policy even prior to the outbreak of the war.
Source: CBR
The negative impact of the security and energy crisis (of 0.8 p.p.) shows in the less favourable macroeconomic development immediately after the outbreak of the war in Ukraine, combined with a hike in energy prices for general government entities and an increase in defence expenditures to 2% of GDP. The CBR considers a portion of the increase in energy costs and defence expenditures to have a permanent effect.
Contributions to the change in the long-term sustainability indicator between 2021 and 2022 (% of GDP)
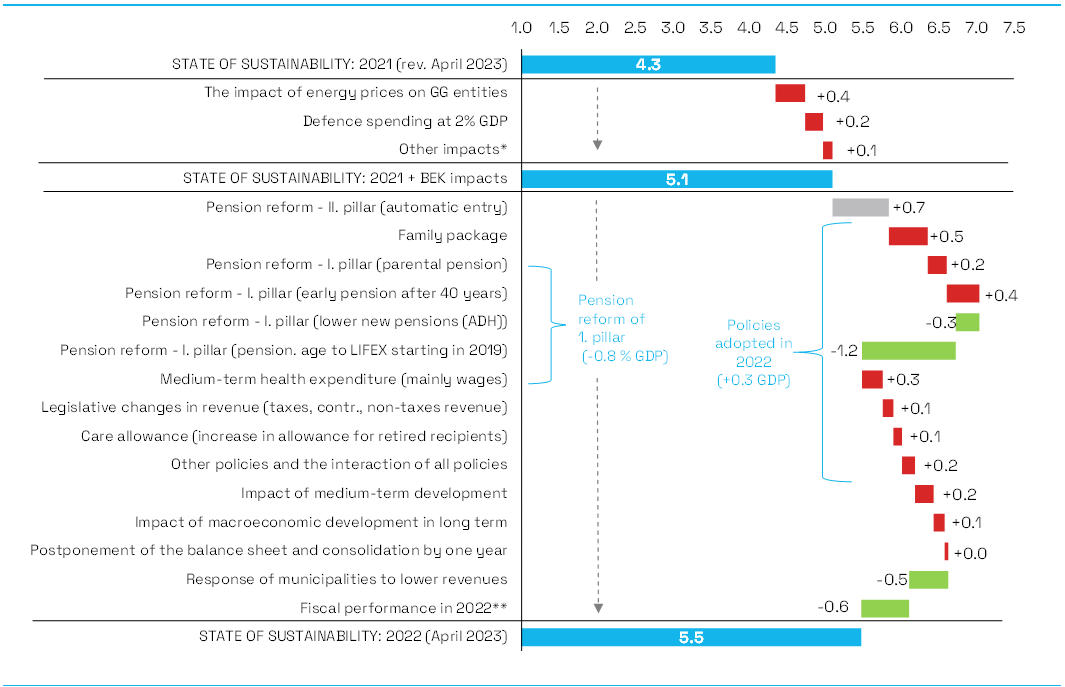
* estimated direct impact of the war in Ukraine on Slovakia’s macroeconomic development
** adjusted for the impact of green energy, defence expenditures (2% of GDP) and a four-year average of investments
Note: BEK – security and energy crisis, including the impact of the war in Ukraine
Source: CBR
In 2022, a number of measures (outside local government) were approved, overall contributing to the deterioration of the long-term sustainability indicator (by 0.3% of GDP without the effect of changes in the second pension system pillar), while their impacts were compensated for by improved fiscal performance in 2022 (contributing 0.4% of GDP)[8] and the assumed response of local governments to a worse development in their balance (contributing 0.5% of GDP)[9]:
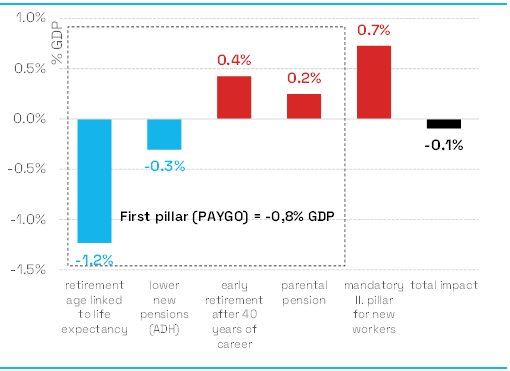
- The reform of the first pension system pillar contributes to improving the long-term sustainability indicator by 0.8% of GDP (which is, however, less than the CBR’s recommendations in last year’s report). Nonetheless, it improves the long-term sustainability through measures with positive impacts that are expected to be felt in the future. Conversely, the introduction of the parental pension and the entitlement to early retirement pension after 40 years of career will increase the Social Insurance Agency’s expenditure and have an immediate negative impact on the long-term sustainability. For a long time, the Council has been warning about the significant risk that, even though the reform of the first pension system pillar improves the long-term sustainability as a whole, the structure of the measures and the varying strength of their legislative protection [10] carry significant risks that may not ultimately lead to the above-mentioned improvement in the long-term sustainability, and in the extreme case, may even cause the long-term sustainability to worsen as a result of the changes.
- The reform of the second pillar, although regarded positively by the Council on a repeated basis, will be contributing to the deterioration of the long-term sustainability of public finances by 0.7% of GDP over a 50-year horizon. The negative impact on the long-term sustainability consists in the asymmetry in general government balance over the 50-year horizon, in particular due to the costs in the form of revenue shortfalls of the pension system (resulting from the introduction of mandatory enrolment for new entrants in the labour market), while savings to be made later in expenditures for pensions of the people concerned are taken into account only partially. Most of these savings will fully materialise as late as after the 50-year horizon. This case shows that, for some measures, most often in the pension system, even a 50-year horizon may be insufficient. The benefits of the second pillar will be more pronounced beyond the horizon for which sustainability is calculated. In presenting the sustainability indicators, the European Commission does not take the effect of the second pillar into account.
Impact of pension reform of the 1st and 2nd pillar on the general government balance
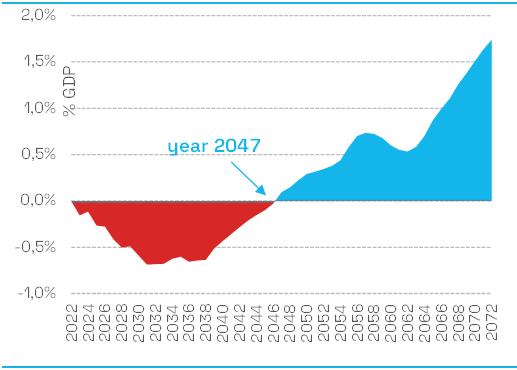
Source: CBR
Impact of pension reform of the 1st and 2nd pillar on long-term sustainability indicator

Source: CBR
- The adoption of the so-called family package, which increases child allowances and the tax bonus, with full effect as from 2023, has significantly contributed to the deterioration of the long-term sustainability. Due to this change, the long-term sustainability worsens by 0.5% of GDP through a permanent increase in the expenditure concerned.
- Other measures deteriorating the long-term sustainability have been implemented in the health sector (notably wage increases in inpatient health care beyond the automatic pay rise mechanism), care allowance has also been increased, while the VAT rate for catering and selected services has been reduced.
Comparison of EU countries
In April 2023, the European Commission published a comparison of the long-term sustainability of public finances, using indicators S2 and S1. According to these results, Slovakia has the worst sustainability of public finances among all EU countries. However, the results are based on the European Commission’s long-term projections prepared in 2021 where, inter alia, neither the adopted pension reform nor the better development of public finances in 2021-2022 are taken into account.
When a comparable methodology for the calculation of the EC’s indicators is applied to the Council’s baseline scenario for public finances over the 2022-2070 horizon, sustainability indicator S2 would reach 5.9% of GDP (medium risk) and sustainability indicator S1 would be at 4.6% of GDP (medium risk). This combination of results would imply a medium-risk zone in the long-term sustainability based on the EC’s criteria for the classification of the long-term sustainability risk. However, Slovakia would still be in the top quarter of EU countries facing the worst problems as regards long-term sustainability.
Long-term sustainability indicator S2
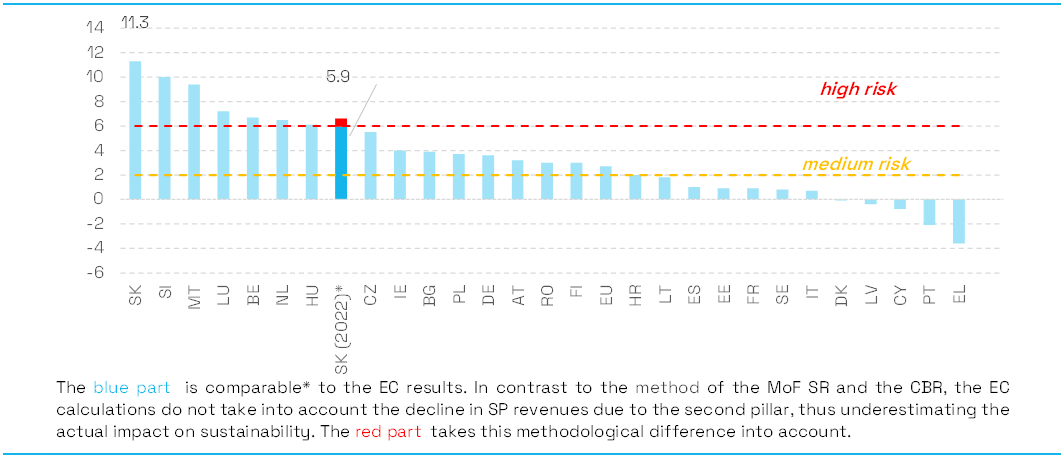
*Indicators S1 and S2 quantified by the CBR using the baseline scenario projection, taking into account the current demographic and macroeconomic assumptions, legislative status as of 31 December 2022. Unlike the EC, which only takes into account the projection of selected expenditure policies in the long term, the Council considers, in its baseline scenario, the long-term projections of all revenue and expenditure items of the general government budget. The blue section of the chart for SK is comparable to EC’s results (not including the impact of the second pillar on revenue).
Source: EC, Debt sustainability monitor 2022, CBR
Long-term sustainability indicator S1
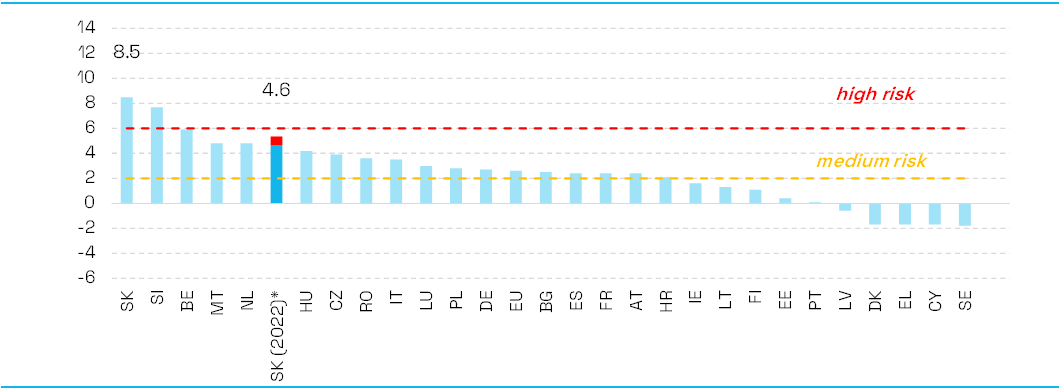
*Indicators S1 and S2 quantified by the CBR using the baseline scenario projection, taking into account the current demographic and macroeconomic assumptions, legislative status as of 31 December 2022. Unlike the EC, which only takes into account the projection of selected expenditure policies in the long term, the Council considers, in its baseline scenario, the long-term projections of all revenue and expenditure items of the general government budget. The blue section of the chart for SK is comparable to EC’s results (not including the impact of the second pillar on revenue).
Source: EC, Debt sustainability monitor 2022, CBR
Compliance with expenditure ceilings should lead to a gradual improvement in long-term sustainability
According to the Council, it is very positive that, after more than 10 years following the adoption of the constitutional Fiscal Responsibility Act, expenditure ceilings were legislated in 2022. Given the current high risk in public finances, expenditure ceilings require consolidation by at least 0.5% of GDP per year. Consolidation will translate into a gradual reduction of the long-term sustainability risk. Within the low-risk zone, the need for consolidation will be eased to 0.25% of GDP until long-term sustainability is achieved. The gradual consolidation in the form of achieving a structural surplus of 0.5% of GDP by 2035 and maintaining it until 2040 will require measures totalling 6.4% of GDP. The volume of measures is higher than the calculated long-term sustainability indicator, as the indicator assumes an immediate consolidation in the full amount as from the next year, i.e., by 5.5% of GDP.
Estimate of a safe debt level has been significantly reduced
General government gross debt reached 57.8% of GDP at the end of 2022 and is expected to fall to 56.2% of GDP by 2025 under the baseline scenario, mainly due to economic growth and the reduction of the above-average cash reserve. Without additional measures, it would subsequently start to increase and exceed the Maastricht criterion of 60% of GDP in 2028. In 50 years, the debt would reach 360% of GDP. The increase in debt is mainly attributable to the automatic deterioration of the balance as compared to 2022 (the effect of increased inflation, including the impact of the security and energy crisis), the adoption of legislative measures which are permanently increasing expenditure, and an increase in expenditure sensitive to population ageing. This is a hypothetical scenario because markets would stop financing Slovakia’s needs already at much lower debt levels. Indeed, when the state departs from a credible fiscal policy, the risk of its default increases, thus leading to higher interest rates in the form of risk premiums. From the perspective of long-term sustainability, it is therefore key to ensure that the current debt levels are kept as low as possible, so that the debt would still remain at a “safe level” even after taking into account the risk of an increase in risk premiums in the future.
A debt ratio staying significantly above the safe level for a prolonged time is associated with an increased risk of downgrading the rating to the non-investment grade in the next 50 years, unless measures are taken to improve the long-term sustainability of public finances. For the 50-year horizon, the Council’s current estimate of a safe net debt level is 44% of GDP, down 12 percentage points in comparison with the last year’s estimates (a 50-year horizon). The primary reason for a significant reduction in the threshold for a safe debt level [11] boils down to the legislative changes adopted during 2022 (more than 10 percentage points), in particular those of a permanent nature and with a fast onset[12] – a package of measures to support families with children and the parental pension. The second, less significant reason includes macroeconomic factors (less than 2 percentage points), namely higher interest rates, slower economic growth, ongoing war in Ukraine, and the inflation and energy crisis.
Traffic Lights for a safe net debt level, 2022 baseline scenario vs. estimated net debt trajectory (Net Debt, % of GDP)
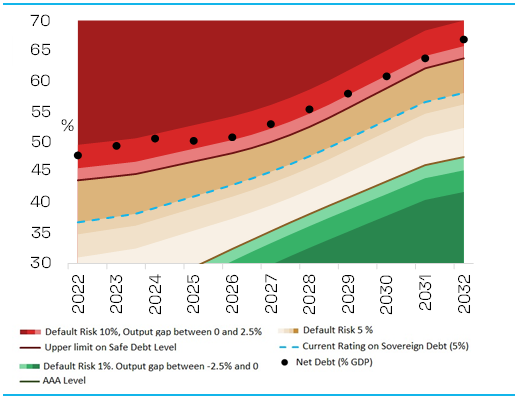
Note: Green and orange shades define, during a negative cyclical shock, the -1% or –2.5% development of AAA rating/the threshold of a safe debt level where rating remains unchanged. The shades of red define the development of the upper limit for a safe debt level under the given scenario within the investment grade during positive cyclical shocks (1%, 2.5%)
Source: CBR
Probability of default – development in the periods between 2022-2071 and 2042-2091
Source: CBR
At the same time, the decline in the upper threshold of a safe debt level can also be illustrated as a sharp increase in the probability of default over the next 50 years, from 5 to 15%. With a rapidly rising debt, even a gradual onset of positive effects of measures which were already adopted and improve the long-term sustainability [13] may not sufficiently suppress the higher probability of default. It will start to increase significantly from 2032 onwards. A rapid increase in the probability of default may be reflected in the downgraded rating followed by a fall to the non-investment grade, increased risk premiums for the government, households and companies, and, consequently, during slower economic growth, more difficult refinancing options and a steeper increase in government debt (snowball effect), significantly above today’s expectations.
[1] The CBR prepares and publishes the long-term sustainability reports, including the baseline scenario and determination of the long- term sustainability indicator, annually as of 30 April and always within 30 days of the parliamentary debate on the government’s manifesto and the vote of confidence in the government.
[2] The security and energy crisis includes the direct impact of the war in Ukraine, including the government’s response to the security situation in Europe by increasing defence expenditures (to 2% of GDP in line with Slovakia’s NATO commitment), and the permanent growth in general government expenditures on energy driven by the transition away from fossil fuels and the response to climate change.
[3] The long-term sustainability of public finances is considered to have been achieved if the long-term sustainability indicator is in the low-risk zone, i.e., less than 1% of GDP. This threshold corresponds to uncertainty associated with long-term projections when, as a result of standard updates to assumptions or improvements in methodology, the indicator may be subject to more significant changes.
[4] The indicator at the level of 1 to 5% of GDP indicates a medium risk. The indicator above the 5% of GDP level is considered a high risk for long-term sustainability.
[5] Because the revised 2021 results improved considerably as well.
[6] The reform of the second pension system pillar (due to a 50-year horizon) deteriorates sustainability by 0.7% of GDP, even though this impact is significantly reduced as the horizon is extended. In presenting the sustainability indicators (on the side of revenues), the European Commission does not take the effect of the second pillar into account.
[7] Only estimated from the start of the war, i.e., it does not reflect, for example, Russia’s energy policy in the autumn of 2021.
[8] The structural deficit improved by 1.2% of GDP in 2022 compared to the no-policy-change scenario. However, part of the improvement is related to factors, the positive effects of which are not included by the CBR, according to the applicable methodology, in a deficit improvement in the medium-term part of the baseline scenario (this involves investments below the 4-year average, lower defence expenditure below 2% of GDP, a positive impact of the green energy subsidy on the balance), including the impact of a delayed increase in expenditure due to a high inflation rate. Taking these factors into account, the fiscal performance in 2022 contributed to an improvement in the long-term sustainability indicator by 0.4 p.p.
[9] The Council assumes that local governments will be forced to compensate the revenue shortfalls and rising expenditures by increasing local taxes, revenues and by permanent expenditure cuts. At present, this assumption is not supported by specific measures. Should the financial situation of local governments improve by increasing transfers from central government in the full extent, the assumption of a positive impact on the sustainability of public finances would not materialise and the overall long-term sustainability indicator would thus reach 6% of GDP.
[10] While parental pension and early retirement pension are enshrined directly in the Slovak Constitution (Article 39(5) and (3)), this is not the case with linking the retirement age to the average life expectancy and reducing the replacement rate of new pensions (current pension value rising at 95% of the average wage growth) which were enacted by an ordinary law.
[11] The CBR considers the upper threshold of a safe debt level to be the level at which the probability of default for the next 50 years is no more than 10%, assuming regular economic times. A value of 10% implies that, without adopting additional measures, exactly one default may occur with a probability of 10% over the next 50 years.
[12] Changes in the primary balance expected in the near future are more relevant for the final determination of the safe debt level than those implemented later. Because of discounting, sudden permanent measures with an immediate onset (parental pension, a package of measures to support families with children) have a greater impact than measures with a gradual onset occurring later in the future (automatic increase in the retirement age, gradual reduction of newly awarded pensions, mandatory enrolment in the second pillar), although their impact may, on the contrary, be more pronounced in the future.
[13] Automatic mechanism for retirement age increase from 2029 onwards, declining replacement rates of newly awarded pensions over the entire horizon.
Galéria